Primarily to assist those who on-charge the cost of notifications (SMS, phone calls, etc) to their customers, the alert log browser now includes the name and numeric ID of the host that triggered the alert.
These records can now be exported in .CSV format in addition to being viewed on screen.
The alert log browser can be found under Settings, Alert Recipients, View Alert History (toward the bottom of the page).
Owing either to high traffic events or server administrators going on holiday without a contingency plan, our users are likely to see lots of downtime throughout the festive season.
To help out, we’ve brought back the plain old telephone system.
As of today, phone call alerts are available in both our server health and uptime monitoring systems. For example, you can configure phone alerts if free disk space falls below 5% for more than 30 minutes – or if CPU load stays at 100% for a bit too long.
Calls are charged at a flat rate of $0.40 per call.
Naturally you can also configure a phone call if your site goes down altogether. A useful escalation schedule might be: Email when the downtime first occurs, send an SMS after 10 minutes, and make the phone call after 30 minutes.
We reckon that a phone call is still the best way to wake up your normally over-caffeinated sysadmin at 4am when The Bad Stuff happens. That little SMS *bleep* noise from their phone doesn’t always do the trick. And knowing that it’s all automatic is even better.
You can learn more about phone call alerts on this page.
Feature Deployed @ 2008-12-01 09:00 GMT
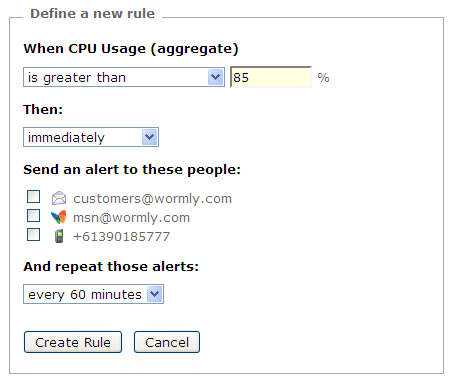
We’re very pleased to announce the immediate availability of our server health monitoring alert system; a feature which has been at the top of our most-requested list for some time now.
A simple screenshot explains it nicely:

Naturally you can also read about the feature in more detail.
For existing users, simply click on your hosts’ Health Monitoring tab and follow the instructions to start using this new feature.
Feature Deployed @ 2008-11-14 09:00 GMT
