Have you worked out which members of your devops team will be on-call this Christmas? Don’t worry if you haven’t, because we’ve just made it much easier to manage who gets alerted when things go wrong.
You can now create multiple Alert Groups – allowing you to assign groups of people to receive alerts for different hosts, and to swap between them easily.
Each of your existing Host-Specific alert settings has been migrated to a new Alert Group, and your default alert recipients are now your Default Alert Group.
We hope you enjoy this much requested feature, and would love to hear your feedback on our implementation.
This deployment did involve significant changes to our alert system, so do let us know if you spot anything that doesn’t look right.
Merry Christmas!
We’ve pushed out a major new release today, featuring:
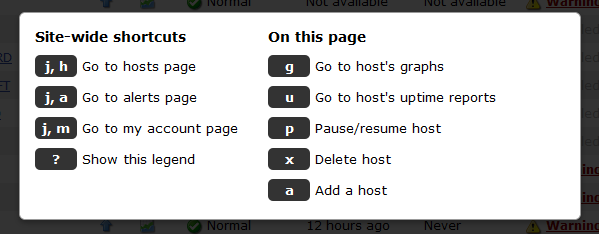
Keyboard shortcuts so you can monitor your apps like a boss! Hit “?” on any page to view the legend:

Automatic resumption of paused hosts & global alert mute.

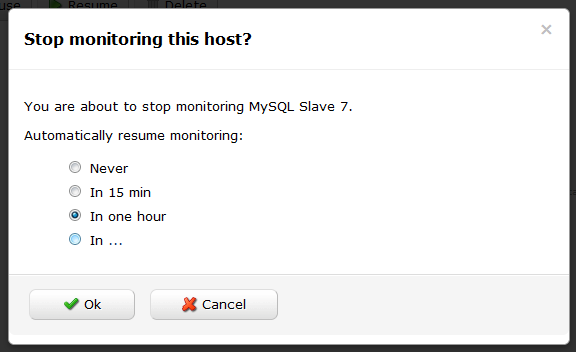
Need to temporarily stop monitoring a host, but don’t want to forget to re-enable it?
Now you can! When you hit the pause button next to a host on the My Hosts page, you will be prompted to specify a time interval after which monitoring will automatically resume.

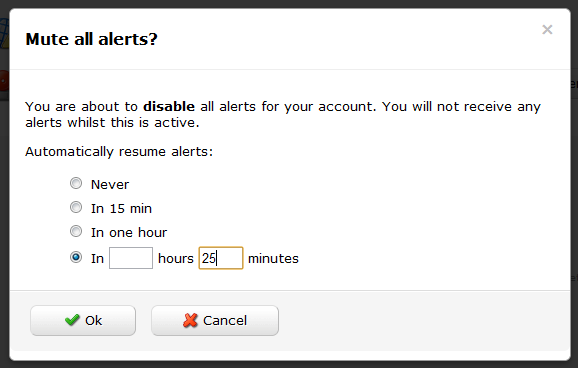
Plus, you can now mute all alerts – great for when your data center has been struck by an earthquake and your phone is ringing off the hook as Wormly yells at the poor sysadmins.
You will find Global Alert Mute on the Alerts page, and it’s offered with the same Auto-Resume functionality described above, so you won’t arrive on Monday morning only to discover that Joe left all of the alerts muted over the weekend when the hurricane arrived.

Wormly’s new keyboard shortcuts will help you manage your hosts & monitoring settings like a boss! We took our inspiration from Github and GMail’s awesome shortcut implementations.
On any page, type “?” to view a legend containing all shortcut keys available on that page.
Global shortcuts
From any page on the site, you can navigate to the three main sections Hosts, Alerts, and My account with two key presses.
Just think “j” for jump, followed by the first letter of the section you want to see. e.g.
- j, h – will take you to Hosts.
- j, a – will take you to Alerts.
- j, m – will take you to My account.
On the My Hosts Page
In addition to the existing search box which filters the host list as you type, you can now use the up and down arrow keys to highlight a host of interest. Once highlighted, hit ENTER to open that hosts’ overview page, or hit TAB followed by any of these keys:
- u – view the hosts’ Uptime Reports
- g – view the hosts’ Performance Graphs
- p – pause / resume monitoring of this host
- x – delete this host
- a – Add a new host
On a Host Overview Page
- u – show Uptime Reports / switch to Uptime tab if Health tab is active.
- g – show Performance Graphs
- h – Switch to health tab
- e – edit hosts’ settings
- a – add monitoring sensors
And a couple more
- Hit “g” from an Uptime Report to switch to the Performance Graphs.
- Hit “u” from Performance Graphs to switch to the corresponding Uptime Report.
We’re pleased to announce the immediate availability of a significantly improved API permissions system. In a nutshell, you can now create API keys with exactly the permissions your app requires:

All of your existing API keys have been preserved with full permissions – so you might like to modify these and limit them to only the permissions they need.
If you haven’t seen the Wormly API, head over to the Developer Center and get started.
First up, we invite you to follow us at our newly acquired @wormly Twitter account, where we’ll be talking about features, updates, bug fixes, and other items generally too small to warrant a blog post.
Today we’ve deployed a bunch of changes to the Wormly API (WAPI), including:
We hope you enjoy them – and rest assured there’s plenty more to come!
We’re delighted to announce two great new features today:
The Wormly SSL Testing Tool
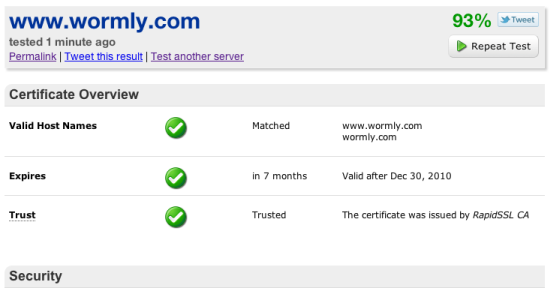
Our newly deployed SSL Tester runs 60+ tests against your secure web server – in real time – reporting crucial compatibility, security and performance factors:

You can quickly share this information with your team using the permalink generated by each test. You will find this tool listed in our free tools section, or access it directly from the footer of any page site-wide.
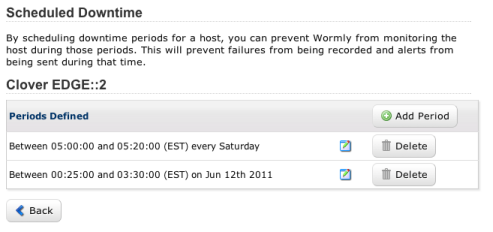
Once-Off Downtime Scheduling
We’ve implemented a small, but often requested feature allowing one-off periods of host downtime to be scheduled:

To configure these periods, select Scheduled Downtime from any Host Overview page.
You can also now schedule a once-off Do Not Disturb period for your alert contacts via a similar interface.
Welcome to the new-look Wormly! A few things in the main navigation bar have changed, so let’s start with those:
- Settings has been renamed to Alerts, and it now contains only things that relate to your alerts.
- Billing has been replaced with My account, which now provides easy access to everything related to managing your account, including profile updates, permissions, billing, invoices and payments.
- The My Wormly page has been removed – everything we had there can be more intuitively access from elsewhere.
- The Log out button turned out to be a rarely used one, and as such it has been moved to the My account page. Oh and we’ve re-branded it Sign out, in keeping with the style of most web apps today.
- Support has been renamed Help, because it includes both our customer support contact form as well as our searchable FAQ section.
- Blog has been removed from the top nav bar; you can now find it in our new “fat-footer”, which contains direct links to many parts of the site that power users will appreciate.
New features and tweaks we hope you’ll enjoy
- Always-on-SSL. Every part of our site is now available only via https to ensure the integrity of your account. We’ve spent lots of time tweaking cache directives, spriting icons and even tuning SSL ciphers to maximize our performance over https. We trust that you’ll find the small performance penalty worthwhile.
- iPad-friendly. We’ve deployed some minor CSS tweaks to allow better use of Wormly from iPad, particularly when in portrait orientation.
- Bigger, better buttons. Accounting for the inexorable move of the web toward touchscreen devices, we’ve made most clickable items throughout the site both a) bigger and b) more obviously clickable.
- When configuring an HTTP sensor, hit Test settings. If a content match fails, you will be given the option to view the full HTTP response that we received from your server.
- From the host overview page, you can now rename a host by hovering your mouse over the host’ name.
- We’ve implemented a work around for this horrible webkit bug to improve pageload speed.
- In the HTTP sensor, POST data is now configured via a multi-line text area.
Please do let us know if we’ve broken anything for you, or if you’re confused or otherwise unhappy with any of these changes.
Alternately, if you just love what we’ve done please let us know anyway!
You might be familiar with this situation:
The firewall sitting in front of your server farm fails, taking your public web site, extranet, API server, mail server down with it.
You’re a proactive sysadmin, so you’ve setup Wormly monitoring for all of these servers with alerts configured to hit your cell phone at the first sign of trouble.
As a result, you’re getting streams of alerts all which are telling you the pretty much same thing: Fix that firewall! All of those beeping text messages might help wake you up when this (inevitably) happens at 4am, but for that purpose our phone call alerts are a much better bet.
We’re pleased to announce a new feature designed to prevent such a flood of alerts. You can now configure Host Dependencies to define what other hosts a given host depends on.
From a host’s overview page, click the Host Dependencies link to get started.
You can read the Q&A entry for more details on how this works.
Otherwise, just remember one important tip: Ensure that the shortest downtime triggering alerts on a host is equal to or greater than the testing interval of all hosts it depends on.
We’re delighted to announce the immediate availability of some exciting new – and much requested – features. The highlights include:
HTTP POST requests.
This enables monitoring of all kinds of interactions including login pages, registration forms, web services & APIs among many others.
Custom request headers.
You can now override any HTTP request header sent by our monitoring system. For example, you might override the Host: header in order to monitor a content distribution network / proxy. Or you might like to set the Referer: header to monitor a search optimized landing page.
Extended content match.
Allows you to match wanted and unwanted content strings in HTTP response headers. For example, you might monitor the correct functioning of a Location: […] redirect by verifying that the correct response headers were sent by your application.
In addition to our HTTP sensor enhancements, we’ve added support for encrypted SSL and TLS connections for monitoring SMTP and IMAP servers, and have also enabled encryption for generic TCP Request sensors.
This will enable you to monitor a whole range of secured TCP services that we were not previously able to establish a connection with.
All of these new features are visible when you add new sensors or modify existing sensors. Naturally no extra costs apply to these features.
We’ve also rolled out a number of usability and performance improvements, with particular focus on the monitoring sensor creation and management process. We hope you’ll find using these new features a breeze!
Naturally we’d love to hear your feedback on these features – and indeed all aspects of our service. Drop us a line via the support desk and let us know how we’re doing.
Keep your eye out for loads more new functionality in the new year!
