TL;DR:
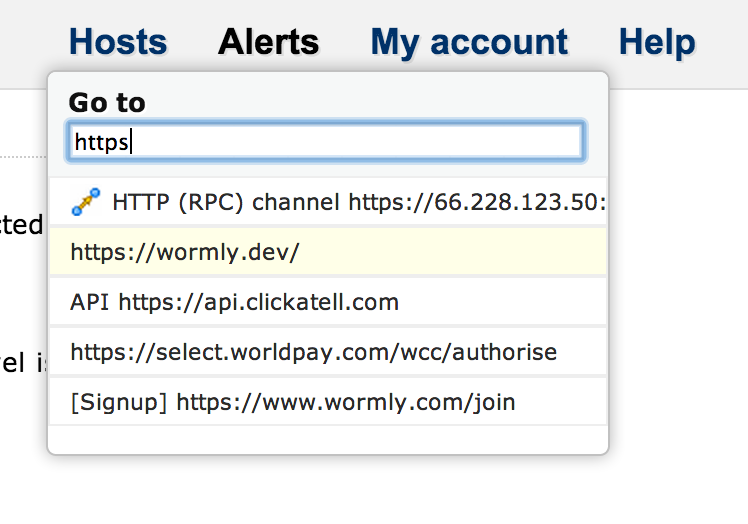
Hit the “/” key and start typing part of a host name, URL, email, phone number then hit “ENTER”. Or “TAB, g” to see graphs.
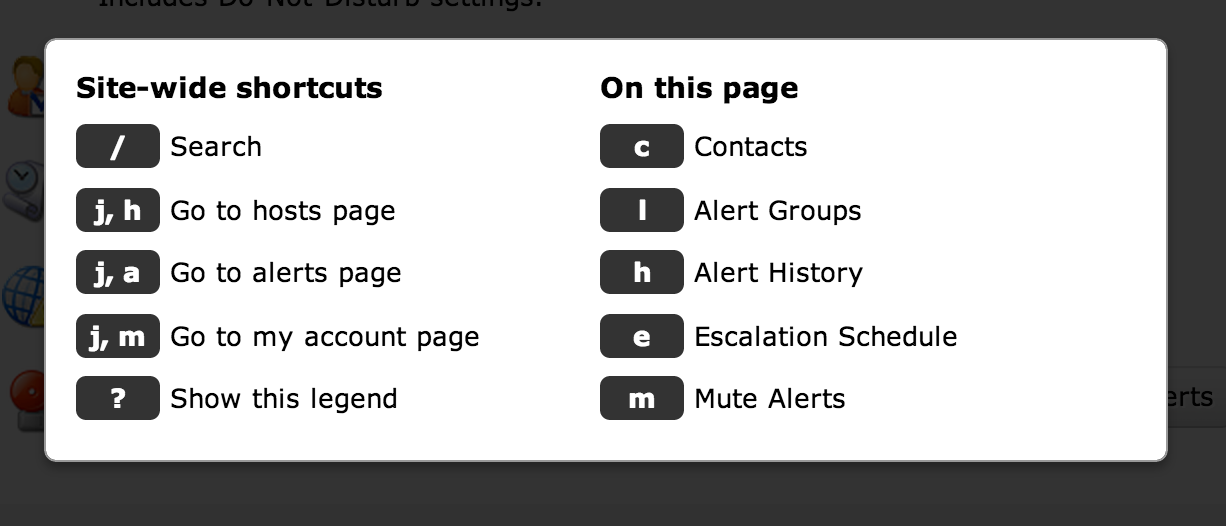
You might not know it, but Wormly has many keyboard shortcuts available: (Hit ? to see them on any page within the app)
Those of you who prefer to avoid the mouse or trackpad have probably already discovered these. Today, however, we’ve shipped a major update to the keyboard UI, notably around the search facility.
Previously you could hit “j, j” to bring up a simple jump-to-host list. Whilst that shortcut still works, we’ve switched to “/” as the trigger because the forward slash has become the standard way to invoke site-searches around the web.
And our search facility now also searches your Sensors and Alert Contacts:
We’ve also added some extra hotkeys which allow you to jump directly to a hosts’ Graphs and Uptime Reports. When you’ve selected the host of interest – either with an exact search term or the arrow keys – you can hit TAB, g to jump straight to that hosts’ Graphs, or TAB, u, for its Uptime Reports:
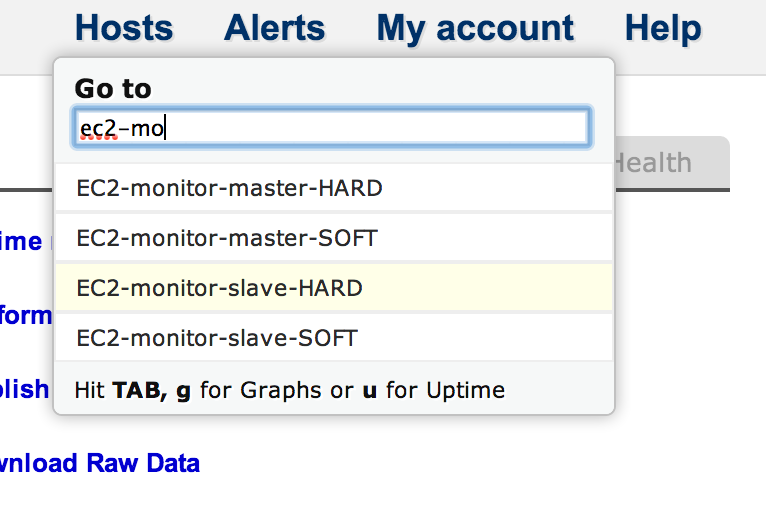
Note that all of these hotkeys and behaviours are also found in the search box on the My Hosts page. No need to hit slash there; since the search box has focus on load. Happy searching, power users!
A couple more shortcuts we added
- When you’re editing a monitoring sensor, hit ENTER to run an Instant Test, and CONTROL-ENTER to save your changes.
- When you’re on any page belonging to a host (e.g. graphs, uptime reports, editing sensors, configuring alert groups, etc), simply hit “h” to jump to the Host Overview page. You will find this hotkey – and others – documented when you hit “?” to view the Keyboard Shortcut legend.
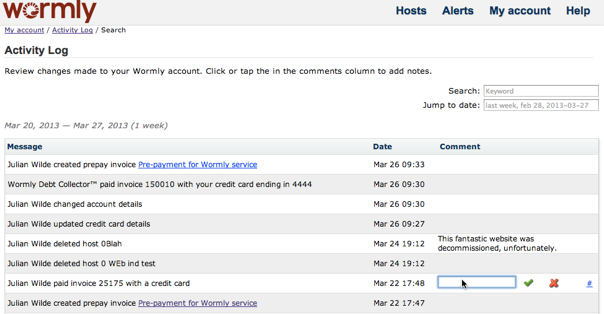
We’ve just shipped a feature much requested by many of our larger customers; every change made to your monitoring configuration is now logged.
In addition to a brief explanation of the event, the timestamp and responsible user is logged.
Users can also add notes to each activity explaining why the change was made.
You’ll find Activity Log linked from My Account.
[Also see our FAQ entry on SSL Certificate Monitoring here.]
An outage caused by an expired SSL certificate is the last thing your DevOps team want their inboxes filled with.
Although, happily, the odds are pretty good that they’ll already be awake when it happens, given that certificates are generally issued with an expiration time identical to the moment the certificate was signed. We presume they weren’t purchasing SSL Certs in their sleep.
Still – much better to ensure that the right people are alerted before expiration. And now Wormly can help you with this small, but critical, task.
You will find a new parameter available in our HTTP Sensor – simply specify the minimum number of days validity that a certificate must possess. Alerts will be generated if that threshold is exceeded.
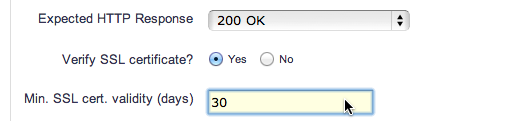
Note that all certificates presented by your server (i.e. the complete certificate chain) will have their expiration dates checked. So a soon-to-expire intermediary certificate won’t go unnoticed, either.
Today we announce Clarity, our new test platform. Clarity offers drastically lower test intervals, right down to 5 seconds – a level that none of our competitors can match.
With Clarity, you can be confident that even the most isolated of failures will be detected and reported. Mission critical systems can now get the level of attention they deserve.
Clarity represents a significant evolution of our core test product, and further improves the already impressive fault tolerance of our distributed monitoring system.
The improved performance of Clarity has allowed us to double the test frequency for all customers on our current plans to 30 seconds, at no extra cost.
Gold, Platinum and Enterprise plans now include High Definition monitoring sensors, at no extra cost.
As always, you can view full pricing details from within your account, or choose from our other plans to find one that suits your needs.
Have you worked out which members of your devops team will be on-call this Christmas? Don’t worry if you haven’t, because we’ve just made it much easier to manage who gets alerted when things go wrong.
You can now create multiple Alert Groups – allowing you to assign groups of people to receive alerts for different hosts, and to swap between them easily.
Each of your existing Host-Specific alert settings has been migrated to a new Alert Group, and your default alert recipients are now your Default Alert Group.
We hope you enjoy this much requested feature, and would love to hear your feedback on our implementation.
This deployment did involve significant changes to our alert system, so do let us know if you spot anything that doesn’t look right.
Merry Christmas!
We’ve pushed out a major new release today, featuring:
Keyboard shortcuts so you can monitor your apps like a boss! Hit “?” on any page to view the legend:

Automatic resumption of paused hosts & global alert mute.

Need to temporarily stop monitoring a host, but don’t want to forget to re-enable it?
Now you can! When you hit the pause button next to a host on the My Hosts page, you will be prompted to specify a time interval after which monitoring will automatically resume.
Plus, you can now mute all alerts – great for when your data center has been struck by an earthquake and your phone is ringing off the hook as Wormly yells at the poor sysadmins.
You will find Global Alert Mute on the Alerts page, and it’s offered with the same Auto-Resume functionality described above, so you won’t arrive on Monday morning only to discover that Joe left all of the alerts muted over the weekend when the hurricane arrived.

Wormly’s new keyboard shortcuts will help you manage your hosts & monitoring settings like a boss! We took our inspiration from Github and GMail’s awesome shortcut implementations.
On any page, type “?” to view a legend containing all shortcut keys available on that page.
Global shortcuts
From any page on the site, you can navigate to the three main sections Hosts, Alerts, and My account with two key presses.
Just think “j” for jump, followed by the first letter of the section you want to see. e.g.
- j, h – will take you to Hosts.
- j, a – will take you to Alerts.
- j, m – will take you to My account.
On the My Hosts Page
In addition to the existing search box which filters the host list as you type, you can now use the up and down arrow keys to highlight a host of interest. Once highlighted, hit ENTER to open that hosts’ overview page, or hit TAB followed by any of these keys:
- u – view the hosts’ Uptime Reports
- g – view the hosts’ Performance Graphs
- p – pause / resume monitoring of this host
- x – delete this host
- a – Add a new host
On a Host Overview Page
- u – show Uptime Reports / switch to Uptime tab if Health tab is active.
- g – show Performance Graphs
- h – Switch to health tab
- e – edit hosts’ settings
- a – add monitoring sensors
And a couple more
- Hit “g” from an Uptime Report to switch to the Performance Graphs.
- Hit “u” from Performance Graphs to switch to the corresponding Uptime Report.
We’re pleased to announce the immediate availability of a significantly improved API permissions system. In a nutshell, you can now create API keys with exactly the permissions your app requires:

All of your existing API keys have been preserved with full permissions – so you might like to modify these and limit them to only the permissions they need.
If you haven’t seen the Wormly API, head over to the Developer Center and get started.
First up, we invite you to follow us at our newly acquired @wormly Twitter account, where we’ll be talking about features, updates, bug fixes, and other items generally too small to warrant a blog post.
Today we’ve deployed a bunch of changes to the Wormly API (WAPI), including:
We hope you enjoy them – and rest assured there’s plenty more to come!